Your CallTime.AI account includes two types of dashboards: a Progress Dashboard and a Performance Dashboard. This article discusses the various components of the Progress Dashboard.
The Time Period
By default, this dashboard will display data for the current week. You can use the dropdown menu in the top-right corner of the dashboard to adjust the time period to one of the pre-sets, or to a custom date range. This will impact the data you see across the entire Progress Dashboard, which means that the goals in the Campaign-Wide Goals and those in the List Goals will only display those that are active during the selected time period. The only section of the dashboard that won't be effected is the Smart Search Results which will only every show current Smart Searches you are tracking.
The Graphs
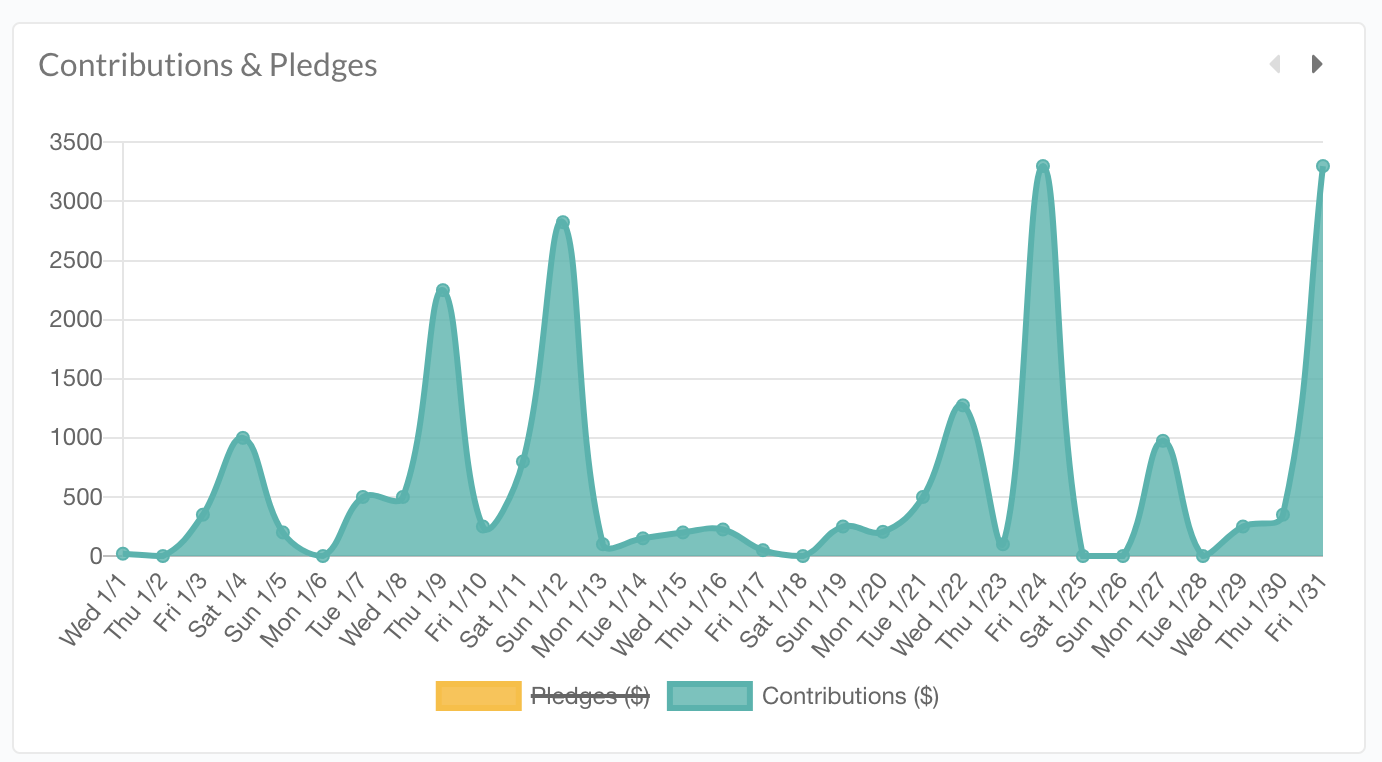
On the right-hand side of the dashboard you will see several graphs that track performance day-by-day within the selected time period. Use the navigation arrows in the top-right corner of the graphs to navigate between the several options. These include:
- Contributions & Pledges: This graph will show the total sum of contributed and pledged dollars logged each day in your account. If you wish to see only contributions or only pledges, click on the legend to remove either contributions or pledges from the graph.

- Call History & Connections: This graph tracks both the total number of logged calls, as well as the number of calls with the "Connected" outcome. You can use the Performance Dashboard to drill down further on your success in reaching people during call time.
- Email Message Sent/Received: This graph will show the number of emails sent from integrated email accounts to contacts in your database, as compared with those received. As with the Contributions & Pledges graph (see above), you can use the legend to view only those email messages received, or those sent.
- Text Messages Sent/Received: This graph will show the number of text messages sent from your CallTime.AI account to contacts in your database, as compared with those received. As with the Contributions & Pledges graph (see above), you can use the legend to view only those text messages received, or those sent.
The Key Stats
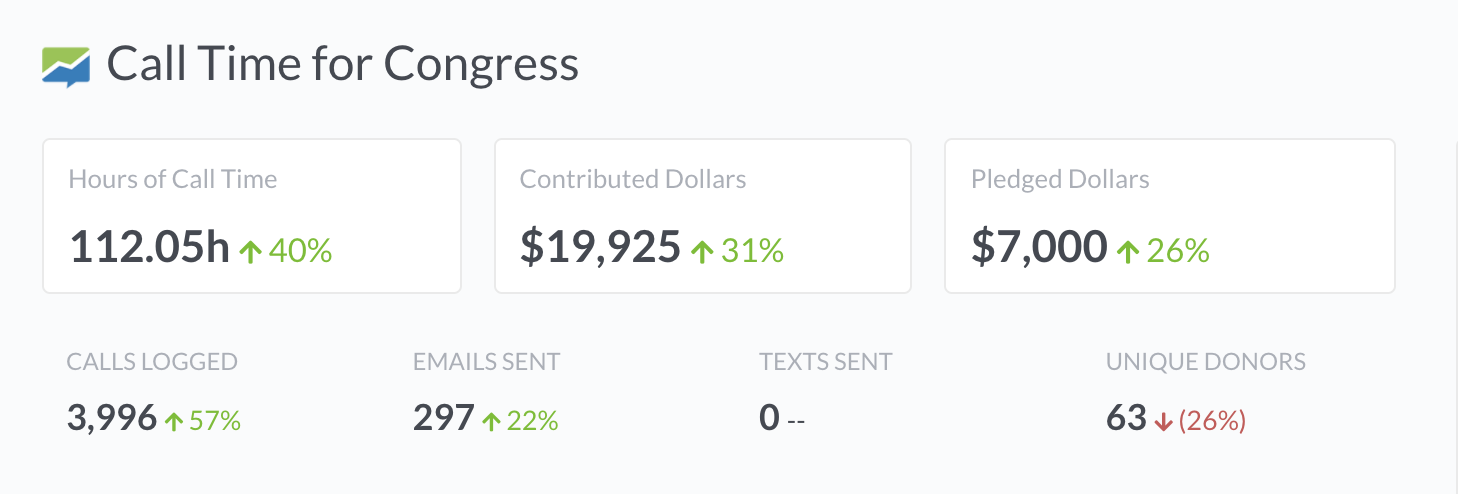
On the left-hand side of the dashboard you will see several key statistics that summarize your progress for key inputs and outputs during the selected time period. These include:

- Hours of Call Time: Counts the total number of hours connected on the power dialer for the selected time period.
- Contributed Dollars: Counts the sum total of all contributions in your account for the selected period, including those that have been manually logged, imported, or integrated via ActBlue.
- Pledged Dollars: Counts the sum total of all pledges in your account for the selected period, including those that have been manually logged, logged during a call, or imported.
- Calls Logged: Counts the total number of calls logged for the selected period, including those logged manually, on the power dialer, or imported.
- Emails Sent: Counts the total number of email sent from integrated email accounts to contacts in your database for the selected period.
- Texts Sent: Counts the total number of text messages sent from your CallTime.AI account for the selected period.
- Unique Donors: Counts the total number of unique individuals that made a contribution or pledge during the selected period.
The Percent-Change Indicators
Next to each of the key stats you will note an indication of how that stat compares to the prior period. As you change the time period (see above) these indicators will automatically re-calculate, based upon the chosen period. For example, if you select This Week as the time period view for the dashboard, each key stat will have a percent-change calculation that indicates how that stat compared to last week.
Tracking Your Goals and Smart Searches on the Progress Dashboard
From this dashboard you can view all your active campaign-wide and list-specific goals for the selected period.
You can read more about Campaign-Wide Goals and how to track them here, and you can read more about List Goals and how to track them here.
You can read more about how to track your Smart Searches on your dashboard here.
Comments
0 comments
Please sign in to leave a comment.