Your CallTime.AI account includes two types of dashboards: a Progress Dashboard and a Performance Dashboard. This article discusses the various components of the Performance Dashboard. Here's how to access this dashboard.
The Performance Dashboard is designed to provide you with data you can use to improve your call time strategy and practices.
The Time Period
By default, this dashboard will display data for the current day. You can use the dropdown menu in the top-right corner of the dashboard to adjust the time period to one of the pre-sets, or to a custom date range. This will impact the data you see across the entire Performance Dashboard.
The Graphs
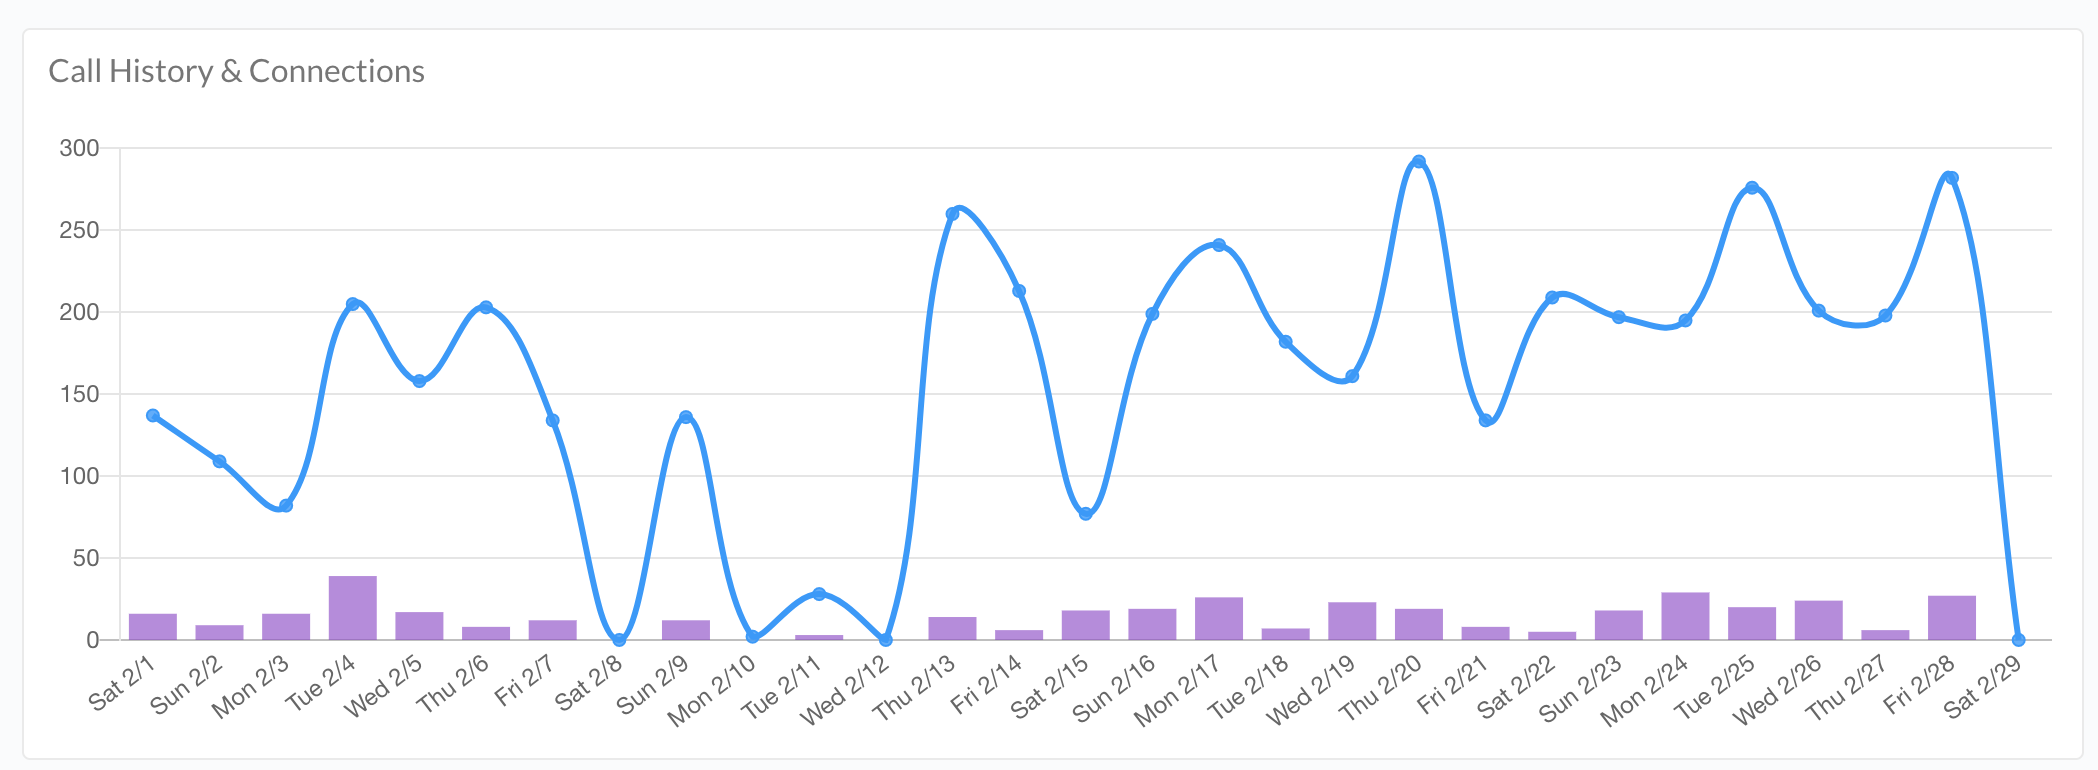
Call History & Connections
This graph is identical to the one available on the Progress Dashboard, and for the selected time period it plots the day-to-day comparison between the number of calls placed, and those that resulted in a successful connection. This includes all calls logged manually, via the power dialer, and/or imported.
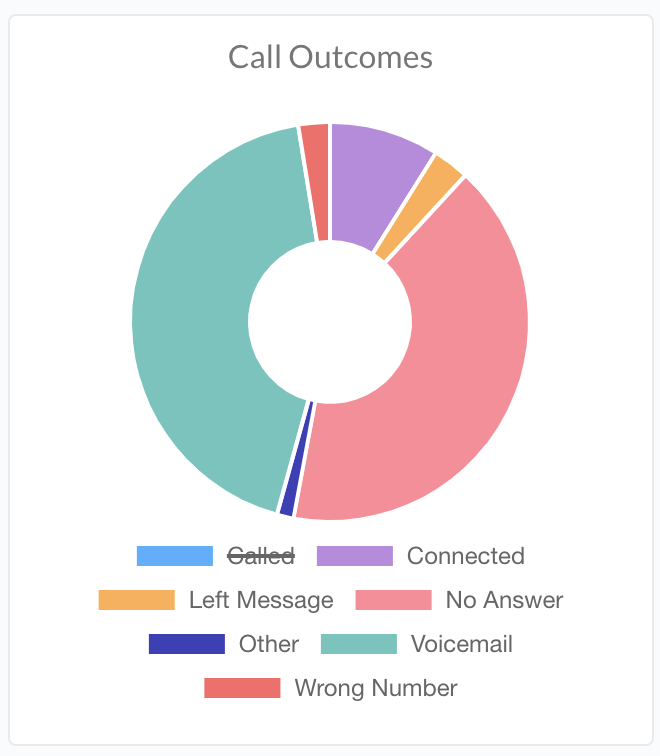
Call Outcomes
This graph shows you the breakdown of call outcomes for the selected period. You can hover over any piece of this chart to see the percent of the total it represents. You can also remove certain outcomes from the graph by clicking on the corresponding label in the legend. This will also recalculate the percentages each of the remaining outcomes make up of the new total.
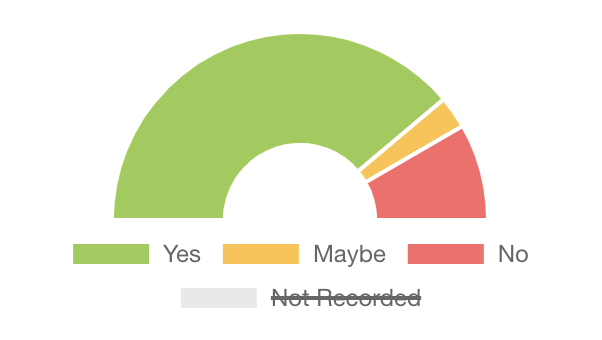
Contribution Ask Results
This graph shows you the breakdown of responses received to contribution asks. You can hover over any piece of this chart to see the percent of the total it represents. You can also remove certain outcomes from the graph by clicking on the corresponding label in the legend. This will also recalculate the percentages each of the remaining outcomes make up of the new total.
Commitment Ask Results
This graph shows you the breakdown of responses received to the other custom commitment asks you have created and are tracking. You can hover over any piece of this chart to see the percent of the total it represents. You can also remove certain outcomes from the graph by clicking on the corresponding label in the legend. This will also recalculate the percentages each of the remaining outcomes make up of the new total.
Connection Rate by Time of Day
This graph calculates your connection rate (percent of total calls placed that end in a Connect outcome) for the selected time period, by hour of the day. This is based on the local time zone of the contact receiving the phone call, and only data from the power dialer is used to generate these calculations. This can be used to better estimate the best times of day to reach people.

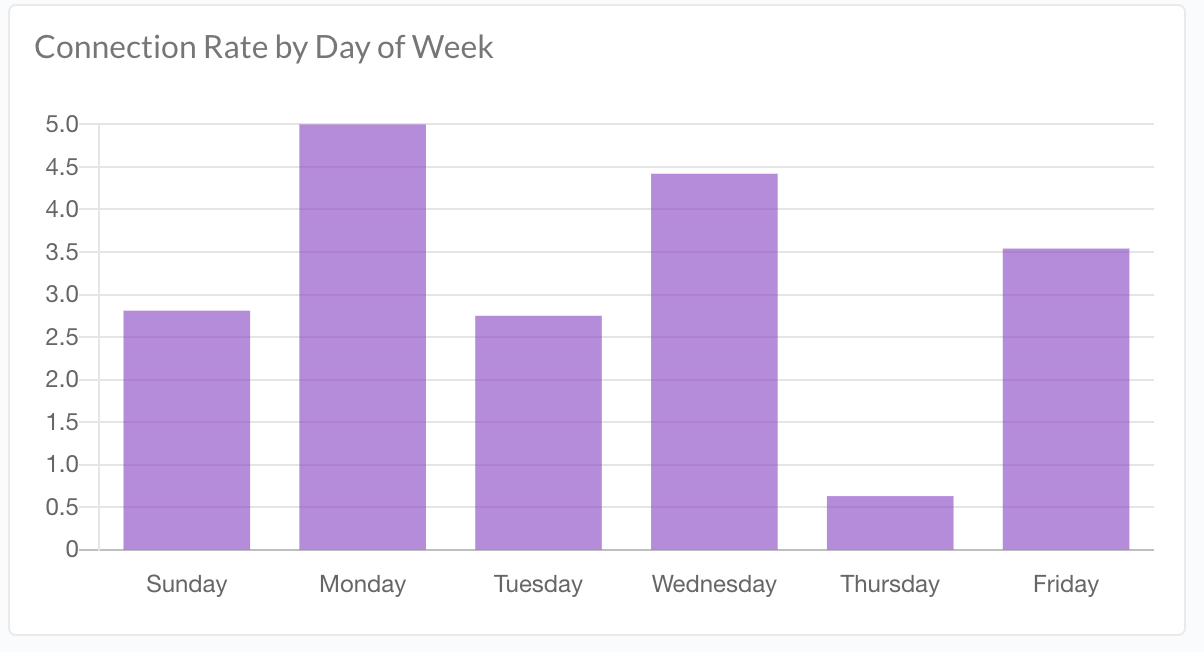
Connection Rate by Day of Week
This graph calculates your connection rate (percent of total calls placed that end in a Connect outcome) for the selected time period, by day of the week. All logged calls are included in these calculations. This can be used to better estimate the best days of the week to reach people.
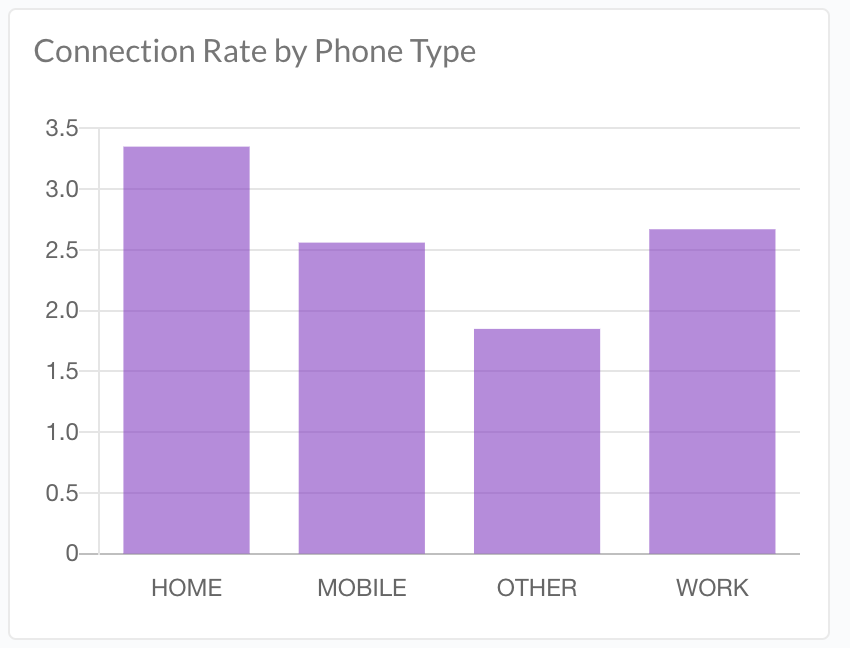
Connection Rate by Phone Type
This graph calculates your connection rate (percent of total calls placed that end in a Connect outcome) for the selected time period, by phone type. All logged calls are included in these calculations. This can be used to better estimate the best phone types to call in order to reach people.
The Key Stats

- Hours of Call Time: Counts the total number of hours the power dialer is used for the selected time period
- Calls Logged*: Counts the total number of calls logged for the selected period, including those logged manually, on the power dialer, or imported.
- Talk Time Per Call: The average amount of time a "Connected" call lasted on the power dialer.
- Connect Rate: The percentage of all calls logged with a "Connected" outcome.
- Pledged $/Hour*: The average amount of pledged contributions logged per hour of call time on the power dialer.
- Pledged From Calls*: The sum total dollar amount of pledges made by contacts within 24 hours of being called.
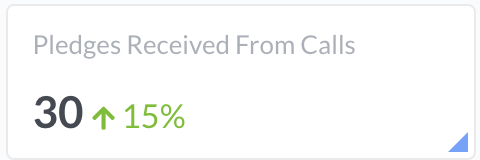
- Pledges Received from Calls*: The count of pledges made by contacts within 24 hours of being called.
- Unique Donors: The count of unique contacts that made a pledge or contribution within 24 hours of being called.
*The asterisked stats above all have a shaded corner which you can click to reveal additional stats:
- Contacts Called*: The number of unique contacts called.
- Contributed $/Hour*: The average amount of contributions logged per hour of call time on the power dialer.
- Contributed From Calls*: The sum total dollar amount of contributions made by contacts within 24 hours of being called.
- Contributions Received from Calls*: The count of contributions made by contacts within 24 hours of being called.
The Percent-Change Indicators
Next to each of the key stats you will note an indication of how that stat compares to the prior period. As you change the time period (see above) these indicators will automatically re-calculate, based upon the chosen period. For example, if you select This Week as the time period view for the dashboard, each key stat will have a percent-change calculation that indicates how that stat compared to last week.
Comments
0 comments
Please sign in to leave a comment.